

Griffith Observatory
Project: Mobile App Design
Client: Griffith Observatory
Duration: 2 Weeks
Team: Christine Gale, Aaron Liu
Platform: Native iOS
Tools: Whiteboard, Post its, Pen and Paper, RealTime Board, Sketch, InVision
My Role: User research, create information architecture, sketch initial UX layouts, conduct user testing, create branding and style guide, and project manage.
About the Project
The Griffith Observatory is an icon of Los Angeles, a leader in public astronomy, and one of Southern California’s most popular attractions.
The Challenge
The Griffith Observatory wants to add value to the visiting experience by integrating a tour that meets their users in current and future tech while maintaining the integrity of their history and good name.
The Solution
Create an app that adds value to the Griffith Observatory visiting experience by aiding navigation, alleviating crowds around exhibits, and creating a more interactive learning experience for Griffith Observatory visitors.
Discover
User Interviews
Competitive and Comparative Analysis
Contextual Inquiry
Understanding Our Users
In order to better understand our audience, we needed to first conduct user interviews. We wanted to know what motivated users to go to the Observatory, what prior planning, if any, they conducted before they arrived. What they looked forward to the most at the Observatory and what they thought could be improved about their experience. We also wanted to know if they would consider using technology, specifically a mobile app, to enhance their experience. If so, what would they expect to see from it?
Below are some key findings we uncovered:


Competitive and Comparative Analysis
We also conducted a Competitive and Comparative Analysis of other iconic museums and tourist attractions. Specifically, we focused our attention on what kind of features our competitors used in their app and their use of information architecture. Our main takeaways were as follows:
Competitors had a strong search function for exhibit attractions
A navigational element was almost always available on the competitors apps
Competitors used onboarding screens or pop ups to inform users about different functions of their app

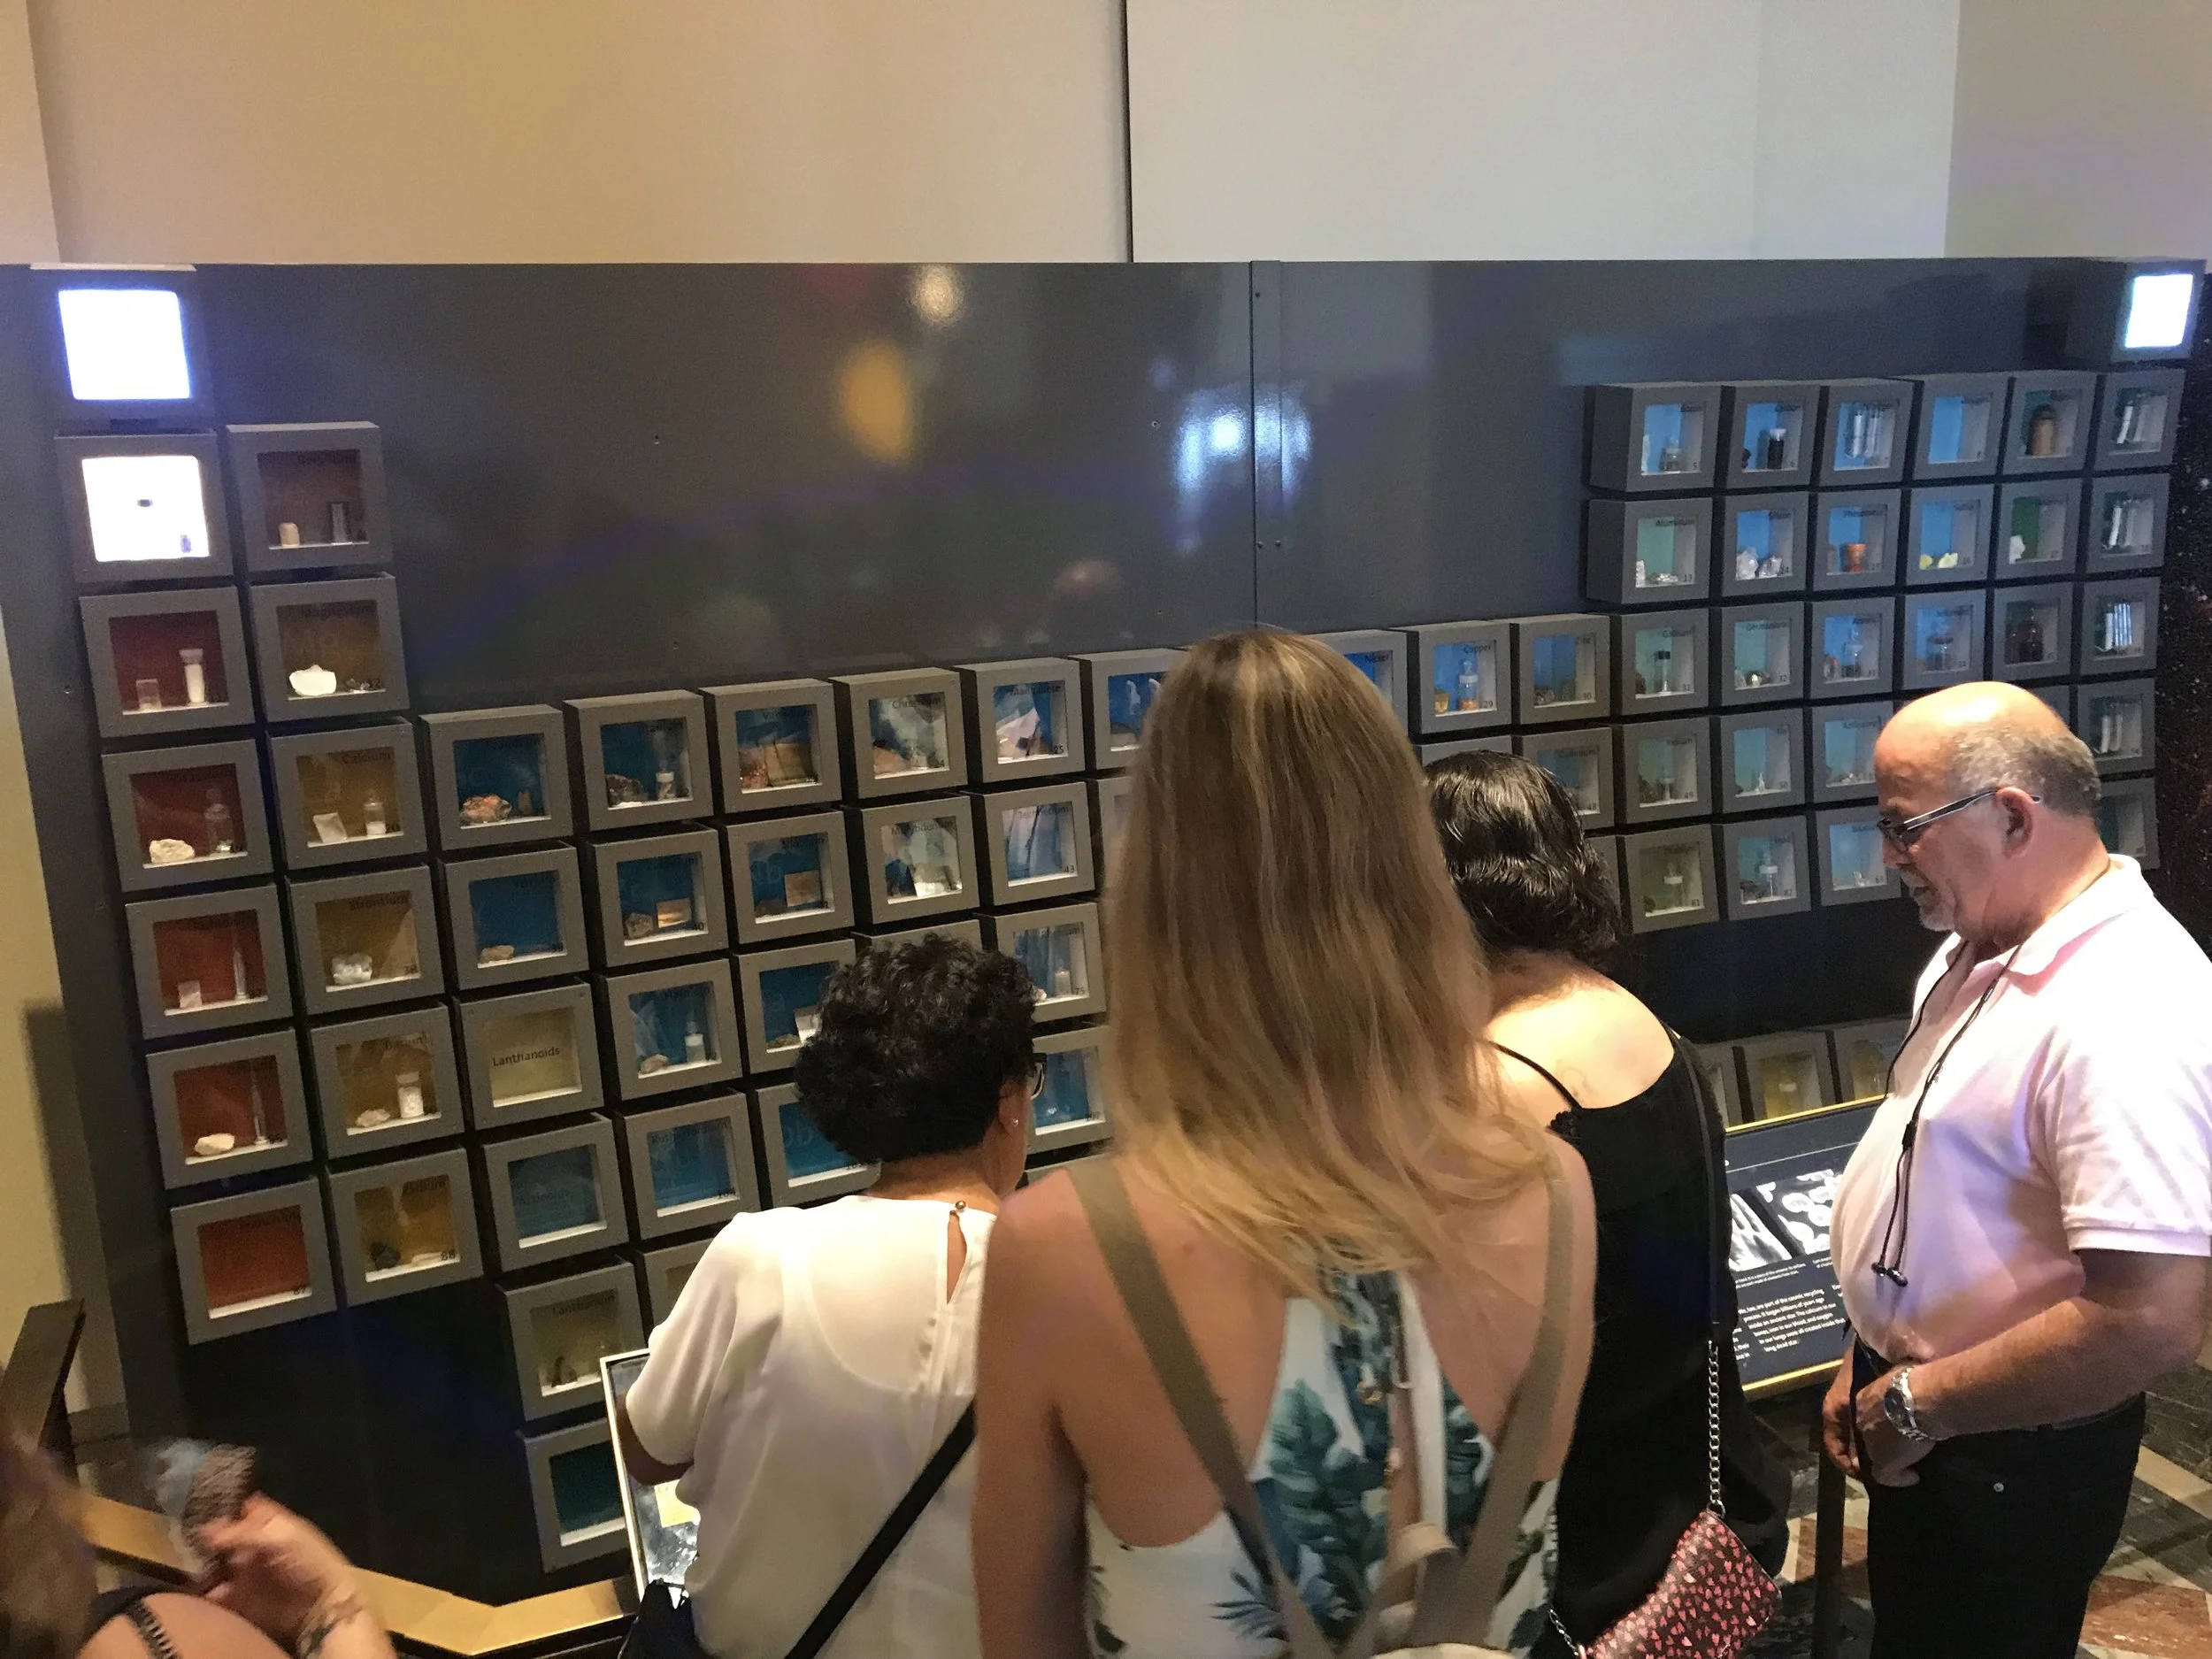
Contextual Inquiry
Lastly, we went to the Griffith Observatory and conducted research about the existing experience without any additional technology. This experience helped us determine pain points and moments that we might enhance a user’s experience.

Define
Personas
Customer Journey Map
Feature Prioritization
User Personas
To help us better understand the needs and goals of our users, we synthesized our data and created three different personas. Our personas formed our decisions to better determine content priority based on specific needs and goals.


Customer Journey Map
From our interviews and contextual inquiry, we were able to create an existing Customer Journey Map of an experience at the Observatory without an app.
Below is a customer journey map of our user’s experience:
Click to enlarge.
Feature Prioritization
After determining our personas, we began synthesizing our research to help us decipher features for our users. Through Affinity Mapping and Feature Prioritization, we were able to exhaust our options and then define our most important and necessary features.
Below is our feature prioritization chart. The lower right circle determines our MVP, the lower left circle determined out essentials (AI), and the upper right circle determined added delights that would altogether create a fleshed out app.
Click to enlarge.

Problem Statement
Our Visitors have trouble navigating the space and want to learn and interact more with the exhibits on their on own.
How might we help enhance their experience?
Develop
Design Challenges
Revised Customer Journey Map
Design Studio
Design Challenges
We discovered from our research that we had a wide variety of users who all have different motivations for going to the Observatory. Thus, we knew that the layout of our app needed to meet the needs of all of our users.
To aid our challenge, we created a site map, detailing the information architecture within the app.
Revised Customer Journey Map
We also referred back to our customer journey map, specifically looking at the pain points and places where we could add delights to the user’s experience. From there, we were able to create a revised Customer Journey map for our users. This enabled us to identify specifically how our users might enhance their experience at the Observatory through our app.
Click to enlarge.
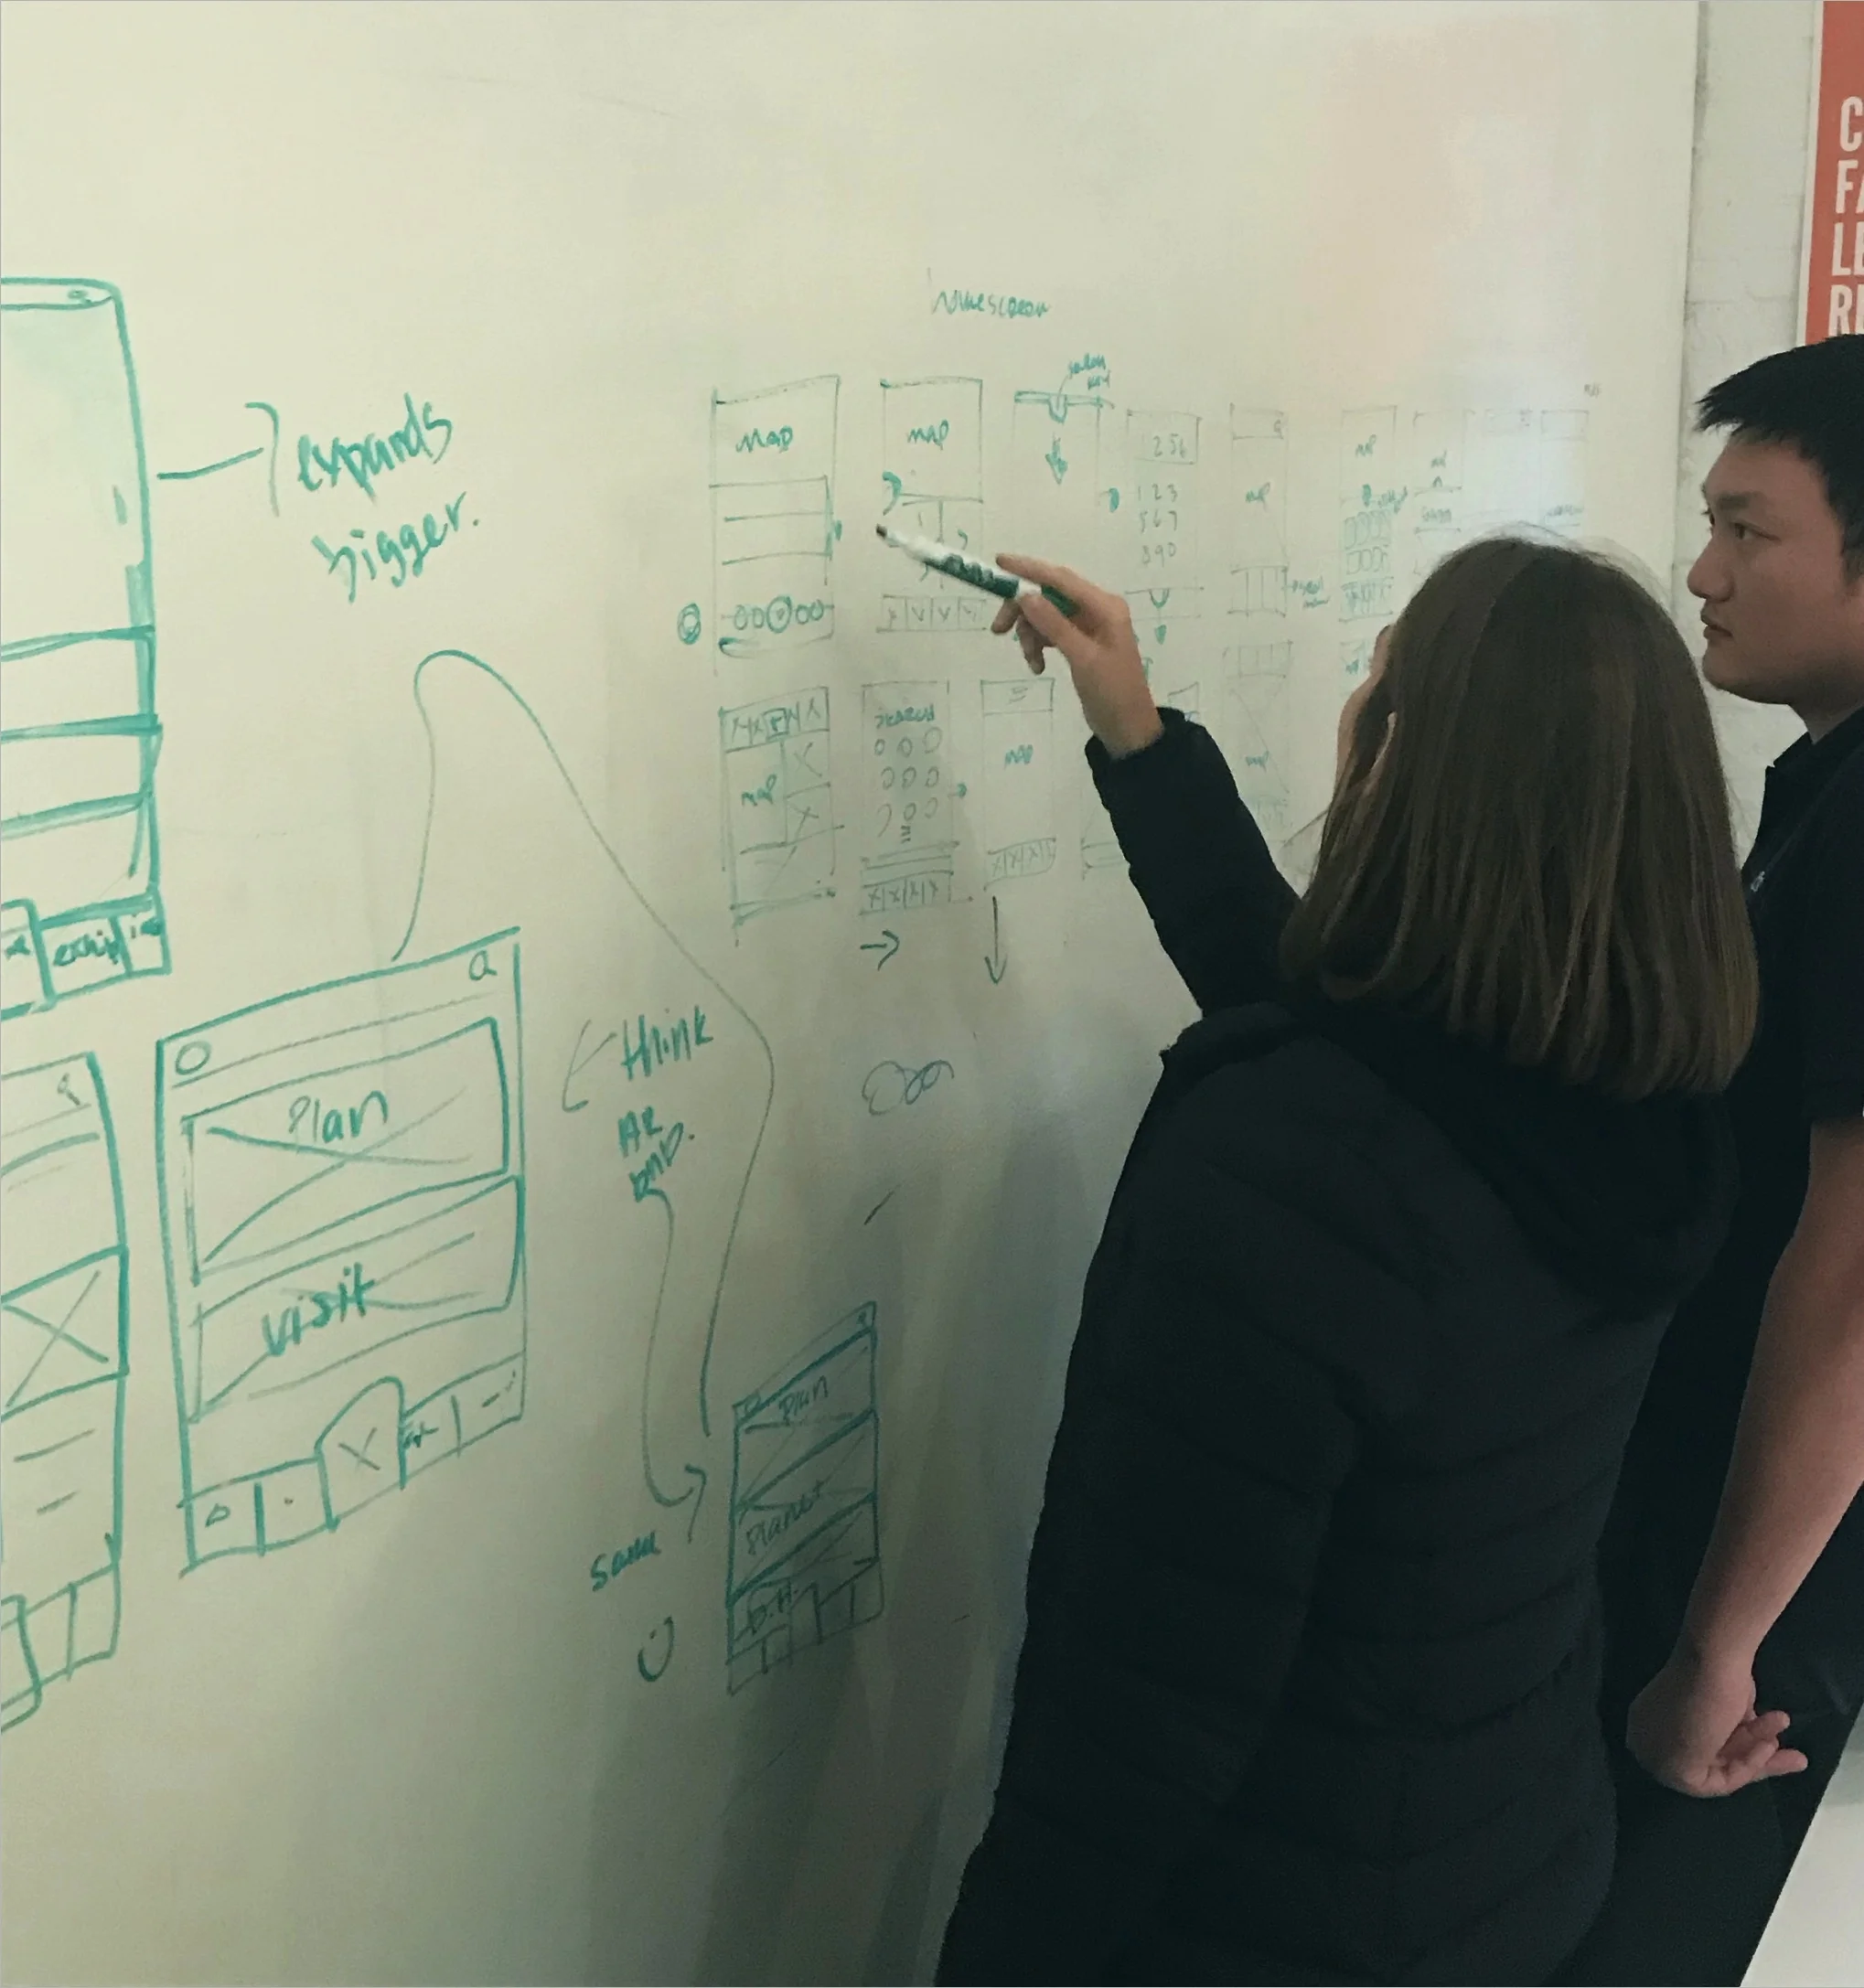
Design Studio
After assessing our user needs and challenges, we began a design studio, a process that allows both my partner and I to exhaust the possible viable options for the app layout. From here, we were able to create our initial wireframes.
Deliver
Wireframes
Usability Testing
Prototype
Wireframes
User Testing
To get a sense of how our users would use the app, we began a series of Usability Tests. We preformed three rounds of usability testing with a low fidelity prototype.

High Fidelity Prototype
Play the video below to watch the prototype.
The final prototype was created in InVision.
Findings
From our usability testing, we were able to make iterations on our initial designs.
Our Key Findings are listed below:
The map needed to have a zoom function for readability.
We needed to create a sense of onboarding to inform our users of certain icons and app features.
We took the High Fidelity Prototype to the Observatory and had a user test it out.
In order to make more changes and iterations, we would need to test the app with more users, gain more feedback, and make iterations from there.